


Unlock the Secrets of Ethical Hacking!
Ready to dive into the world of offensive security? This course gives you the Black Hat hacker’s perspective, teaching you attack techniques to defend against malicious activity. Learn to hack Android and Windows systems, create undetectable malware and ransomware, and even master spoofing techniques. Start your first hack in just one hour!
Enroll now and gain industry-standard knowledge: Enroll Now!
The crypto ETF market experienced a dramatic selloff as investors pulled more than $333 million from U.S. Spot Bitcoin ETFs and a staggering $465 million from Ethereum ETFs in a single trading session, raising questions about the sustainability of the current bull market.
BlackRock’s flagship ETF products, IBIT and ETHA, accounted for over 84% of the total outflows recorded on August 4.
— Crypto Seth (@seth_fin) August 5, 2025
Blackrock institutional clients net sold yesterday.$BTC -$292M$ETH -$375M
This is the first significant outflow since February. Thoughts? pic.twitter.com/IJYz30weJ2

The institutional asset manager, previously known for accumulating substantial BTC and ETH positions, is now facilitating large-scale liquidations on behalf of its investors.
Crypto ETF Selloff is “PTSD from 2017 & 2021” – Bull Run Far From Over
The widespread speculation that the crypto bull run may have reached its peak appears justified as Bitcoin retreated to $111,920 lows, failing to reclaim the $116,000 level throughout August.
Similarly, Ethereum touched $3,357 support levels and continues to face resistance at the $3,700 threshold.
The selloff extended beyond BlackRock, with Fidelity and Grayscale also reporting significant outflows from their crypto Spot ETFs, approximately $49 million in Bitcoin and $91 million in Ethereum over the past 24 hours.

BlackRock’s Ethereum ETF experienced its most substantial outflow since inception, with 101,975 ETH tokens valued at $375 million being liquidated, effectively ending the asset manager’s 21-day consecutive inflow streak.
ETH ETFs were bloody red today:
— fabda.eth (@fabdarice) August 5, 2025133.1K ETH ($465M) of outflows.
On the bright side, ETH ended up green for the day (+6.3%). pic.twitter.com/s0fBqhjbiM
The collective Ethereum ETF outflows reached $465.1 million, marking the largest single-day net redemptions since spot Ether ETFs launched in July 2024.
Crypto investor Ted Pillows acknowledged the market’s anxiety surrounding the recent ETH ETF outflows, noting that many participants view this as a potential cycle peak indicator.
However, Pillows maintains that the current fear lacks fundamental backing, describing it as “emotional baggage” and “PTSD from previous market crashes in 2017 and 2021.”
Given that ETF participants are approximately 60% retail investors, Pillows suggests the current reaction represents profit-taking driven by fear rather than strategic positioning.
Ethereum Technical Analysis: ETH Eyes $4,050 Bullish Flag Breakout Despite ETF Selloff
From a technical perspective, Ethereum’s 4-hour chart displays a classic bullish flag formation that recently broke higher, indicating potential trend continuation.
The price surge from below $3,400 to the $3,700 zone has led to consolidation within a tight range, currently retesting the breakout area.
The measured target from this flag pattern suggests a move toward the previous swing high resistance near $4,050, representing approximately 10% upside potential from the breakout level.
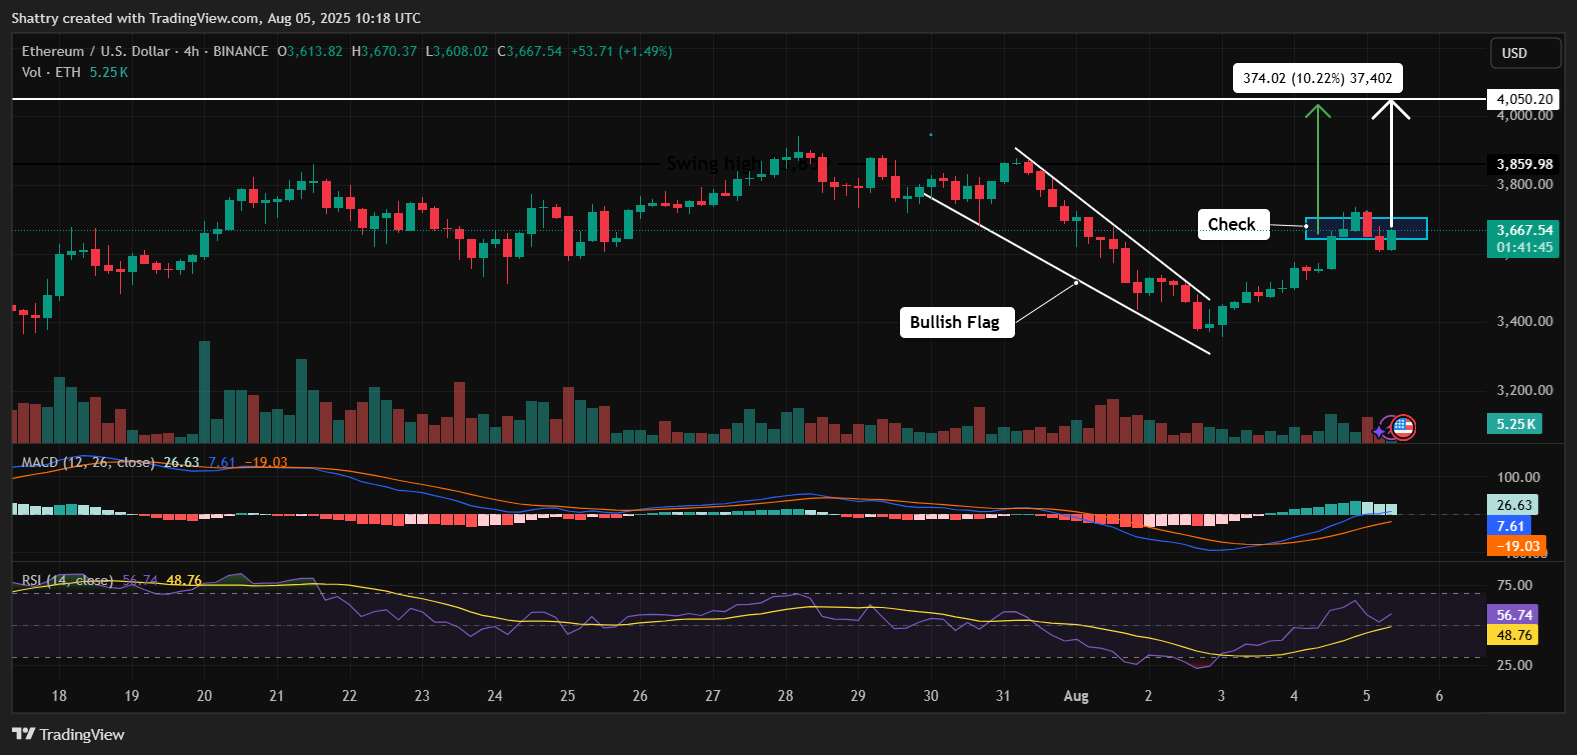
The MACD indicator reinforces this bullish outlook, having crossed into positive territory with the MACD line advancing above the signal line and the histogram displaying increasing bullish momentum.
Meanwhile, the RSI reading of 56.74 shows upward momentum while remaining well below overbought conditions, indicating room for additional gains before exhaustion signals emerge.
CryptoQuant analyst Abramchart shares this optimistic perspective regarding Bitcoin, stating that the BTC price remains within a bullish zone, primarily supported by Long-Term Holder (LTH) confidence and conviction.
The analyst attributes the current dip and selling pressure to short-term holders and retail participants.
Julio Moreno, Head of Research at CryptoQuant, concurs that the crypto bull market is not yet over, explaining that Bitcoin is currently experiencing its third significant profit-taking wave in the present bull cycle, leading to a consolidation and correction phase before the next upward movement.
Profit, Pause, Push: Bitcoin is undergoing its third major wave of profit-taking in the current bull market.
— Julio Moreno (@jjcmoreno) August 1, 2025
This leads to a period of consolidation/correction before the next leg up.
View our most recent report, published yesterday, in the post belowpic.twitter.com/Xu2kq035N3
Bitcoin Technical Analysis: Wave V Target $126,300 As Elliott Analysis Points Higher
Bitcoin’s daily chart reveals a distinct Elliott Wave pattern, with price currently consolidating in wave iv just below recent peaks around $120,000.
This follows earlier consolidation phases in waves II and III, both of which resolved with bullish breakouts.
The RSI Divergence Indicator shows recent bearish divergences during July highs, signaling momentum deterioration and explaining the ongoing pullback.
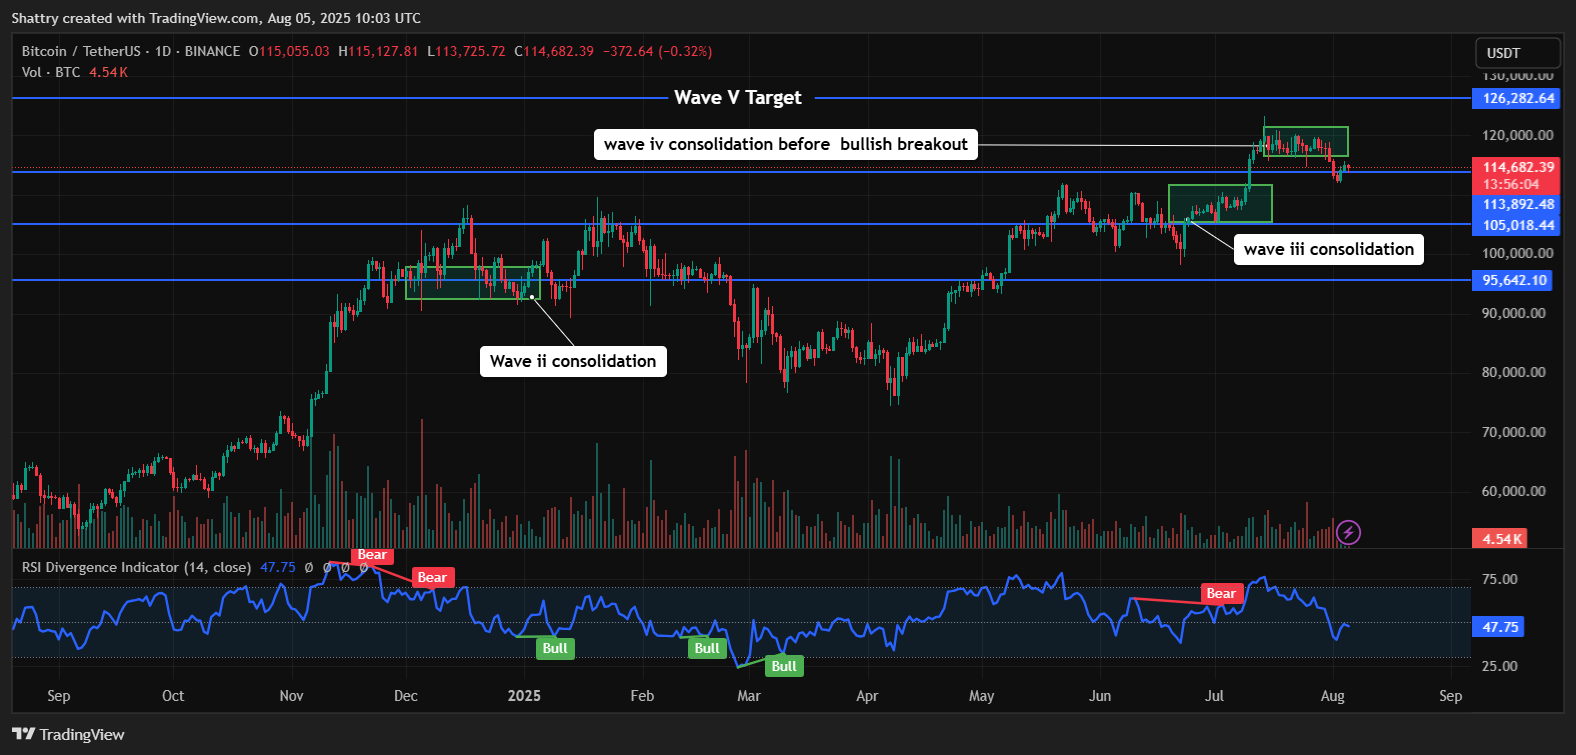
However, the RSI currently hovers near 47.75, suggesting weakening bearish momentum, as previous bullish signals from RSI lows in March and May preceded strong rallies.
Critical horizontal support levels are positioned around $113,900 and $105,000, with the crucial support zone at $95,600 serving as the invalidation point for the bullish wave structure.

Should Bitcoin maintain these support levels with buyer intervention, the chart suggests consolidation could complete wave IV and trigger a bullish breakout toward the projected wave V target at approximately $126,300.
Failure to hold support could result in a deeper correction before any potential recovery.
The post Crypto ETF Selloff: Bitcoin Loses $333M, Ethereum $465M in Single-Day Outflows – Bull Run Over? appeared first on Cryptonews.
Unlock the Secrets of Ethical Hacking!
Ready to dive into the world of offensive security? This course gives you the Black Hat hacker’s perspective, teaching you attack techniques to defend against malicious activity. Learn to hack Android and Windows systems, create undetectable malware and ransomware, and even master spoofing techniques. Start your first hack in just one hour!
Enroll now and gain industry-standard knowledge: Enroll Now!
0 Comments